
Thumbstop rate measures how often a scroller actually stops to watch your video's opening seconds, calculated as early-view count divided by impressions. For cold prospecting on Meta feed, a moderate to good rate is generally expected, with Reels and other short-form placements often running higher. The one catch: TikTok and Meta measure that "early view" on different clocks, so raw cross-platform comparisons will mislead you before you even reach the benchmark table.
TL;DR:
- Cold prospecting thumbstop rates on Meta feed typically range from 18% to 28%, with short-form placements like Reels often exceeding these benchmarks.
- Comparing thumbstop rates across TikTok and Meta requires adjusting for different attention measurement windows, with Meta counting at three seconds and TikTok often at two seconds.
- A trustworthy thumbstop rate calculation needs proper column setup, ad-level export, and a minimum sample size of a few thousand impressions to avoid misleading data.
- Low thumbstop rates usually result from static openings, brand-first logos, or irrelevant audiences, which can be improved with quick, targeted micro-edits to the first few seconds.
- Utilizing managed creator networks that guarantee view volume accelerates testing of multiple hook concepts faster than internal teams with limited scale or creator relationships.
Table of Contents
- What Is Thumbstop Rate, and Why Do Platform Windows Change the Math?
- How Do Thumbstop Benchmarks Vary by Placement and Audience?
- How Do You Calculate Thumbstop Rate in Ads Manager?
- How Do You Fix a Weak Thumbstop Rate?
- When Does a Managed Creator Network Beat In-House Hook Testing?
- Thumbstop Is the Start of the Funnel, Not the Finish
- Ready to Test Hooks at Scale Without Burning Retainer Budget?
- Sources
- FAQ
What Is Thumbstop Rate, and Why Do Platform Windows Change the Math?
Thumbstop rate (also called hook rate) is a video ad's early-attention score. The core formula is simple: divide 3-second video views by impressions, then convert to a percentage. Meta exposes a dedicated 3-second video views column in Ads Manager for exactly this purpose.
The complication is that "3 seconds" isn't a universal standard. TikTok's platform-native attention metrics often use a 2-second window, while Meta counts at 3 seconds. A creative metrics glossary from Spark UGC makes the point directly: comparing a TikTok thumbstop number against a Meta one without adjusting for that gap is comparing two different metrics wearing the same name.
Two formula variants show up in practice:
- Basic percent formula: 3-second views ÷ impressions, the standard for most Meta reporting.
- Time-window variant: substitutes ThruPlays or a platform-specific short view event when a platform doesn't expose a clean 3-second column.
Build your spreadsheet with raw view counts and raw impressions as separate columns, then calculate the ratio as its own field. Never eyeball percentages pulled from two different ad accounts side by side.
How Do Thumbstop Benchmarks Vary by Placement and Audience?
Benchmarks only mean something once you stop averaging across placements and audiences that behave nothing alike. A cold prospecting Reels ad and a warm retargeting feed ad are not competing in the same event, even when the creative looks similar.
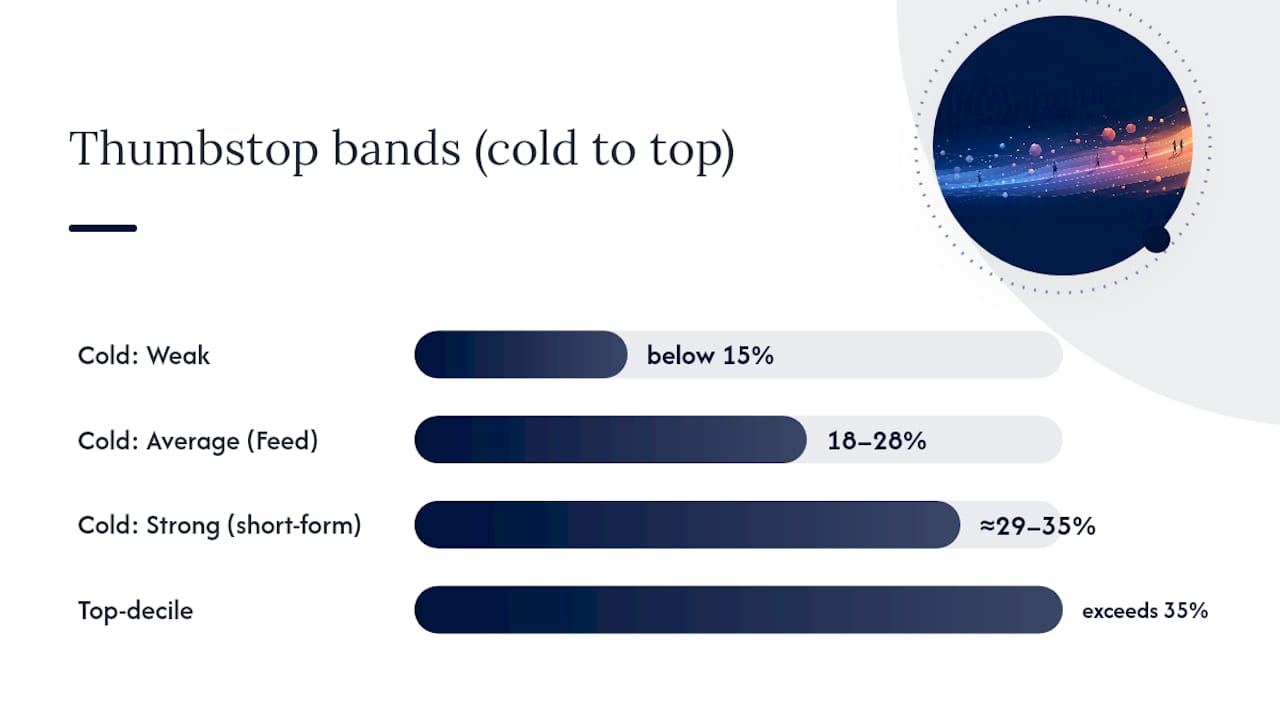
Cold prospecting benchmarks (new audiences, no prior brand exposure):
- Weak: below 15%, usually a hook problem, not a targeting problem
- Average: 18% to 28% on Feed placements, the practitioner-standard Meta hook benchmark
- Strong: high 20s to mid 30s percent, common on Reels and other short-form placements where scroll velocity is faster and format expectations favor punchy openers
- Top-decile: creative built specifically for the platform's native feel can exceed even the strong band, particularly when it uses talent, motion, or a pattern interrupt in the first frame
Cold-feed anchor: Practitioner data puts cold-feed thumbstop in the 18% to 28% range for Meta, with short-form placements trending several points higher.
Warm and retargeting benchmarks run noticeably higher, sometimes well above the cold bands, because the audience already recognizes the brand and has a reason to keep watching. That inflation is a feature of the audience, not a signal that your retargeting creative is outperforming your prospecting creative. Judging cold-feed hooks against retargeting bands is one of the more common benchmarking mistakes marketing teams make.
Vertical matters too. Beauty and fashion advertisers tend to run higher thumbstop averages industry-wide, while B2B and financial services typically sit lower. A creative metrics glossary recommends calibrating against your own account's trailing average rather than chasing a universal number pulled from an unrelated category.
Reels and other short-form placements deserve their own lane in your reporting. The format trains viewers to expect fast cuts and immediate payoff, so a Feed-style slow open that would pass on static placements often tanks on short-form.
How Do You Calculate Thumbstop Rate in Ads Manager?
Getting a trustworthy number takes five steps, and skipping any one of them is how teams end up benchmarking against noise.
- Add the right columns. In Ads Manager's customize columns menu, add "3-second video plays" (or ThruPlays if your account uses that event) alongside impressions.
- Export at the ad level, not the campaign level. Averaging across creatives buries your winners and losers together.
- Build a custom metric: 3-second video plays ÷ impressions, formatted as a percentage. Meta's own video metrics reporting guide flags a common error here, forgetting to format the field as a percent, which multiplies your rate by 100 on export and quietly wrecks every downstream comparison.
- Tag each row with placement, creative ID, and audience temperature (cold, warm, retargeting) before you calculate anything.
- Set a minimum sample size. Don't trust a thumbstop rate calculated on fewer than a few thousand impressions; early data swings wildly.
Pro Tip: Name your custom metric with the platform window baked in, like "TSR_Meta_3s" or "TSR_TikTok_2s." It looks like overkill until someone on your team pastes a TikTok number next to a Meta number in the same dashboard column and draws the wrong conclusion.
For dashboards, plot thumbstop rate against spend and impressions side by side rather than as a standalone tile. A high rate on a tiny sample tells you nothing.
How Do You Fix a Weak Thumbstop Rate?
A low number always traces back to one of four causes, and the fix depends entirely on which one you're looking at.
Diagnose first:
- Static opening frame: no motion in the first half-second, the scroll thumb never registers a reason to stop
- Brand-first opener: logo or product shot before any human or hook, which reads as an ad and gets skipped
- No motion or sound cue: silent, still creative loses the muted autoplay battle instantly
- Wrong audience: the hook works, but you're showing it to people with no reason to care
Match the fix to the diagnosis. A growth library breakdown from Exactius ties root causes directly to remedies: re-edit the first 1 to 3 seconds before touching anything else, put a real person on screen instead of a product shot, add bold text cards for sound-off viewers, and test a talent-led open against a motion-graphics open before assuming the whole concept has failed.
Pro Tip: Most thumbstop problems get solved with a micro-edit to the opening three seconds, not a full reshoot. Re-cutting an existing clip's first frame is often the fastest, cheapest lever you have.
Run these as structured A/B tests, not gut-feel swaps:
- Predefine your kill floor before launch (for example, drop a variant if thumbstop rate falls under 15% after 5,000 impressions).
- Give every variant its own creative ID so placement-level reporting doesn't blend results.
- Watch for week-over-week drops greater than 5 percentage points as an early warning that creative fatigue is setting in.
When Does a Managed Creator Network Beat In-House Hook Testing?
In-house testing works when you have volume. It breaks down when you need to validate ten hook concepts and don't have the impressions or the creator relationships to do it fast. That's the gap a commission-only creator network is built to close.
- Guaranteed view volume turns a hook hypothesis into a dataset in days instead of weeks of incremental organic spend testing.
- Multiple creators testing variations in parallel surfaces winning hooks faster than one internal team iterating sequentially.
- What to require from any managed partner: verified view counts, unique creative IDs per asset, and attribution checks that tie views back to install or signup events, not just watch time.
Paying for guaranteed views only makes sense when the learning speed outweighs the cost of waiting on organic volume to accumulate naturally.
Thumbstop Is the Start of the Funnel, Not the Finish
A strong thumbstop rate with a weak hold rate or flat CTR just means people stop, then leave. Treat thumbstop as the first checkpoint, then look at hold rate and click-through before deciding whether to scale spend. If thumbstop is strong but conversions lag, the fix is in the body or the CTA, not the opening frame. Check these three metrics weekly, and escalate to a full creative refresh once thumbstop drops more than 5 points from your account average.
— Jax
Ready to Test Hooks at Scale Without Burning Retainer Budget?
Cult Media is the alternative to hiring an in-house UGC team for hook validation: you pay per verified view a real creator delivers, not a flat fee regardless of outcome. That structure matters most when you have five or ten hook concepts to test and no time to wait for organic reach to tell you which one wins.

A commission-only creator network pairs guaranteed view campaigns with end-to-end creator management so you're not chasing individual creators or negotiating rates one at a time, which is key for product launch videos for startups. Before hiring any vendor for hook testing, ask three questions: how are views verified, do you retain full content rights, and can you get creative-ID-level reporting instead of blended averages. If those answers matter to you, see how the guaranteed view model works and get a sense of whether it fits your current testing backlog. For teams weighing view-level metrics against paid efficiency, it's also worth understanding how CPM and CPI compare before committing budget either way.
Sources
- How to Read Video Metrics in Meta Ads Manager | AdSights
- Hook, Hold & Thumbstop Rate: A Creative Metrics Glossary | Spark UGC
- Thumb Stop Rate | Growth Library | Exactius
FAQ
How do you calculate thumbstop rate?
Divide 3-second video views by total impressions, then multiply by 100 to get a percentage. Meta exposes a 3-second video views column in Ads Manager specifically for this calculation, and formatting the custom metric as a percent avoids the common export error of multiplying by 100 twice.
What are realistic Meta ad benchmarks going into 2026?
Cold-prospecting thumbstop rate on Feed placements typically runs 18% to 28%, with Reels and other short-form placements often trending several points higher. Retargeting and warm-audience creative usually scores substantially higher than either band, since audience familiarity inflates the number independent of hook quality.
What counts as a good click-through rate on Facebook?
CTR benchmarks vary heavily by vertical, objective, and placement, so there's no single universal figure that applies across every campaign type. A more reliable approach is tracking your own account's trailing CTR average and treating meaningful deviations from it, rather than an external number, as your signal.
What is a thumbstop?
A thumbstop is the moment a scrolling viewer physically stops their thumb to watch a video, and thumbstop rate quantifies how often that happens per impression. It's an early-funnel attention metric, not a measure of full engagement or conversion, so it should always be read alongside hold rate and click-through before any budget decision gets made.