Most app teams use "conversion rate" to mean two different things without realizing it, and that's why their benchmarking conversations go in circles. Page-view-to-install conversion runs around 25% on US iOS listings, while impression-to-install sits closer to 3.6% to 3.8% globally. The gap between those numbers is the entire reason category-wide "good conversion rate" claims mislead more than they help. Always name the funnel stage and the category before comparing your app to anyone else's.
TL;DR:
- The page-view-to-install benchmark on US iOS listings is about 25%, with category differences affecting this rate significantly.
- Impression-to-install rates globally hover between 3.6% and 3.8%, but redownload-heavy categories can inflate these figures during seasonal peaks.
- Upstream metrics like click-to-trial and trial-to-paid vary widely depending on app type, paywall design, and category, influencing overall conversion quality.
- Comparing conversion rates across platforms like iOS and Google Play is unreliable due to different measurement methods, so each should be optimized separately.
- Improving store pages through testing visuals and localization yields higher returns than increasing paid ad spend when initial conversion funnel metrics fall below category medians.
Table of Contents
- What App Install Conversion Rate Actually Measures
- How to Measure Conversion Rate Without Comparing Apples to Oranges
- Benchmarks by Funnel Stage and App Category
- Why iOS and Google Play Conversion Numbers Rarely Match
- How to Improve Your App Install Conversion Rate: A Prioritized Playbook
- Using Benchmarks Correctly: A Segmentation Checklist
- Why Creator-Driven Traffic Often Converts Better Than Cold Paid Traffic
- Author Perspective: Where to Focus First and What Trips Teams Up
- When a Performance-Based Creator Network Makes Sense
- Sources
- FAQ
What App Install Conversion Rate Actually Measures
An app install conversion rate is not one metric. It's a family of metrics, each tied to a different stage of the acquisition funnel, and mixing them up is the single most common measurement error in mobile growth.
Start with the stages themselves. An impression is a user seeing your app icon or ad unit in search results, browse tabs, or a paid placement. A product page view happens when that user taps through to your actual store listing, whether that's an App Store product page or a Google Play Store listing. An install is the completed download. Beyond install, teams track activation (the user opens the app and completes a meaningful first action), trial start (for subscription apps), and paid conversion (the trial converts to a paying subscriber or a purchase event fires).
Three metrics matter most in daily practice:
- Impression-to-install (ITI): the full-funnel conversion from someone seeing your listing to actually downloading it. This is the 3.6% to 3.8% iOS global benchmark.
- Page-view-to-install (PVI): the conversion from someone who already tapped into your product page to completing the install. This is the metric closest to what ASO practitioners mean when they say "conversion rate," and it's the ~25% iOS US baseline.
- Combined funnel math: ITI roughly equals impression-to-page-view rate multiplied by PVI. If 15% of impressions generate a page view, and 25% of those page views convert to installs, your ITI lands around 3.75%, right in line with the global average.
Run the math backward when your numbers don't add up. If your ITI is healthy but PVI is weak, your traffic quality is fine and your store listing is the problem. If PVI is strong but ITI is weak, your icon and search visibility need to work before your listing does.
How to Measure Conversion Rate Without Comparing Apples to Oranges
Every platform reports a different slice of the funnel, and using the wrong tool for the wrong question wastes weeks of testing time. App Store Connect reports impressions, product page views, and downloads segmented by territory and source type. Google Play Console reports store listing visitors and install conversion but bundles some traffic sources differently than Apple does. Product analytics platforms like Amplitude or Mixpanel pick up where the stores leave off, tracking activation, retention, and paid conversion once a user is inside your app. Attribution platforms like AppsFlyer stitch the acquisition side to the in-app side, which is where segmentation gets real.
That segmentation is not optional. Benchmarking a blended number hides the signal you actually need.
- Traffic source: paid audiences from Apple Search Ads, Google's UAC, or Meta convert at different rates than organic search or referral traffic, and aggregating them produces a number that describes nothing real.
- Territory: a listing that converts at 30% in the US might convert at 12% in a market where your screenshots aren't localized.
- Device and OS version: older devices and OS versions sometimes see different rendering of your store assets.
- CPP variant: if you're running custom product pages, each variant needs its own conversion tracking, not a blended average.
- Organic vs. paid: paid installs almost always convert lower on page-view-to-install than organic search traffic, because paid users arrive with less intent-driven context.
SKAdNetwork and Google's Privacy Sandbox changes have made postback-based attribution noisier for paid campaigns, particularly at low volume. Aggregated postbacks delay and bucket data, so treat any single-day paid conversion number with caution until you've accumulated enough volume to smooth out the noise. When in doubt, weight your store console data more heavily than a third-party dashboard for the store-page metrics specifically.
Benchmarks by Funnel Stage and App Category
Cross-vendor benchmark reports disagree with each other constantly, and that disagreement is itself useful information: it tells you how much redownload counting, sampling method, and traffic mix distort a single published number. Treat every table below as a directional cohort reference, not a pass/fail grade.
The page-view-to-install baseline for US iOS listings sits around 25%, but category spread is wide. Utility and productivity apps, where the use case is obvious from a glance at the icon and title, tend to convert page views into installs at a higher rate than apps that require more explanation, like finance or education tools with complex value propositions. Games sit in the middle, heavily influenced by genre and whether the store listing leans on screenshots versus gameplay preview video.
Impression-to-install runs much lower across the board, averaging 3.6% to 3.8% globally on iOS. Categories with high redownload rates, travel apps used seasonally, retail apps tied to shopping events, tend to show inflated ITI numbers during peak periods because the platform counts returning users alongside first-time installs. If your ITI jumps 40% during a holiday week, check whether that's new-user growth or a redownload spike before you credit any single creative change.
Downstream of the install, subscription apps typically see download-to-trial conversion between 3.7% and 8.9%, with trial-to-paid conversion landing between 38% and 54% depending on paywall design and category. Retail and e-commerce apps look at install-to-purchase instead, and that band typically runs between 1% and 2%, with travel apps trending higher, around 2.41% in recent samples, likely because travel purchases carry higher intent by the time someone installs the app at all.
| Funnel stage | Typical benchmark | Category notes |
|---|---|---|
| Page-view-to-install (PVI) | ~25% (iOS, US) | Utility/productivity trend higher; finance/education trend lower |
| Impression-to-install (ITI) | 3.6%–3.8% (iOS, global) | Redownload-heavy categories (travel, retail) can appear inflated |
| Download-to-trial (subscription apps) | 3.7%–8.9% | Depends heavily on paywall placement and onboarding friction |
| Trial-to-paid (subscription apps) | 38%–54% | Varies by trial length and category |
| Install-to-purchase (retail/e-commerce) | 1%–2% | Travel apps trend higher, around 2.41% |
Pro Tip: Before you compare your app to any published benchmark, pull your own App Store Connect peer-group data first. Apple groups your listing against apps with similar category and size, and that cohort is a closer match to your reality than any cross-industry average.
The widest ranges in any benchmark table usually mean the category itself is heterogeneous, not that the data is unreliable. "Finance apps" covers everything from a budgeting tool to a full brokerage platform, and those two products will never share a conversion profile. When your category spread looks suspiciously wide, narrow your comparison set by sub-category and business model before drawing conclusions.
Why iOS and Google Play Conversion Numbers Rarely Match
Comparing your App Store rate directly to your Play Store rate for the same app almost always produces a number that looks wrong, and it usually isn't. The two platforms measure, sample, and report differently enough that a direct comparison misleads more often than it informs.
- Apple and Google handle redownloads differently, which shifts reported conversion rates in categories with high reinstall activity, like seasonal or event-driven apps.
- Third-party analytics vendors sample impression and page-view data differently across the two stores, so the same app can show different PVI numbers depending on which tool generated the report.
- Custom product pages on iOS and store listing experiments on Android don't map to identical test structures, so a "listing experiment" on one platform isn't directly portable to the other.
The practical takeaway is to test each platform on its own terms rather than chasing platform parity. On iOS, prioritize custom product pages, preview video quality, and the first three screenshots, since App Store users make decisions fast and visual hierarchy carries most of the weight. On Android, the short description and feature graphic do more work than they get credit for, because Google Play's listing layout surfaces that text earlier in the decision path than Apple's does. Treat each platform as its own optimization track with its own baseline, not two rows in the same spreadsheet.
How to Improve Your App Install Conversion Rate: A Prioritized Playbook
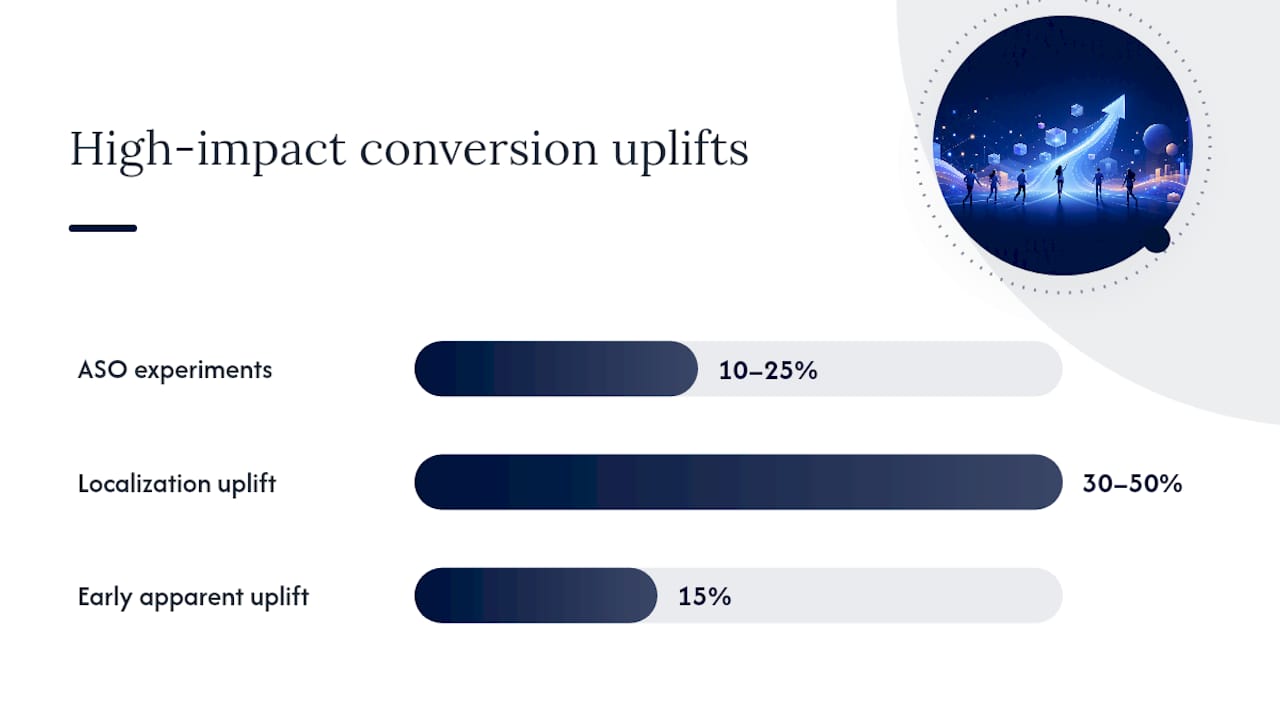
Fix the store page before you touch the media buy. If your page-view-to-install rate sits more than 10 percentage points below your category median, no amount of additional paid spend will fix a listing that's already losing the users it convinces to click through. Listing experiments and ASO changes commonly produce 10% to 25% conversion lifts on their own, which is a higher-leverage move than most creative refreshes on the paid side.
Here's the order that actually works, based on what moves the needle first:
- Test screenshots and preview video before anything else. These are the highest-visibility assets on your store page, and small changes to ordering, captions, or the first frame of your video routinely swing PVI by several points.
- Test icon, title, and subtitle together, not separately. These three elements work as a unit in search results and browse placements. Changing one without the others often produces confusing results.
- Build a ratings and review program. Localization can deliver 30% to 50% more downloads in target markets, and apps with ratings above roughly 4.4 stars and more than 100 reviews see measurably steadier conversion, since new users treat review volume as a trust signal before they treat star rating as one.
- Localize beyond translation. Screenshots, preview video captions, and even icon treatments should reflect the target market, not just the language.
- Run custom product pages aligned to specific paid creative. If your ad shows a specific feature, your CPP should land on that same feature, not a generic homepage view of the app.
- Layer in creator-driven, contextual content. Structured UGC campaigns give users context before they ever hit your store page, which changes what they expect to see once they land there.
- Track paid and creator campaigns with unique promo codes so you can separate install quality by source rather than crediting all installs equally.
On testing cadence, give listing experiments two to six weeks depending on your traffic volume before calling a result. Low-traffic apps often can't reach statistical significance on their own organic volume alone; in that case, a short paid or creator-driven push to generate testable sample size is worth the spend before you trust any A/B result.
Pro Tip: Don't declare a winner just because one variant is ahead after three days. A variant that looks 15% better on day three regularly regresses to the mean by day fourteen once weekday and weekend traffic mix evens out.
Using Benchmarks Correctly: A Segmentation Checklist
Before comparing your numbers to any published benchmark, confirm you're comparing the right cohort:
- Match the funnel stage exactly. Don't compare your PVI to someone else's ITI.
- Match the category and, where possible, the sub-category. "Games" is too broad; "puzzle games" is closer.
- Match the store. iOS and Google Play numbers don't transfer.
- Match the territory. A US benchmark tells you nothing about your conversion in Brazil or Japan.
- Match the traffic source. Blended organic-plus-paid numbers hide more than they reveal.
A useful decision rule: if your page-view-to-install rate sits more than 10 percentage points below your category median, stop scaling paid spend and run a listing experiment first, since pouring budget into a leaking funnel just buys more expensive leaks. The remediation sequence that works in practice is audit your current funnel stage by stage, run one focused experiment at a time, measure against your own baseline for at least one full testing cycle, then scale spend only once the listing itself is converting at or above your peer-group median.
Why Creator-Driven Traffic Often Converts Better Than Cold Paid Traffic
Contextual creator content gives a user a reason to install before they ever see your store listing, which changes install quality, not just install volume. A user who watched a creator demonstrate a specific feature arrives at your product page already sold, and that shows up downstream in activation and retention rates, not just the raw conversion number.
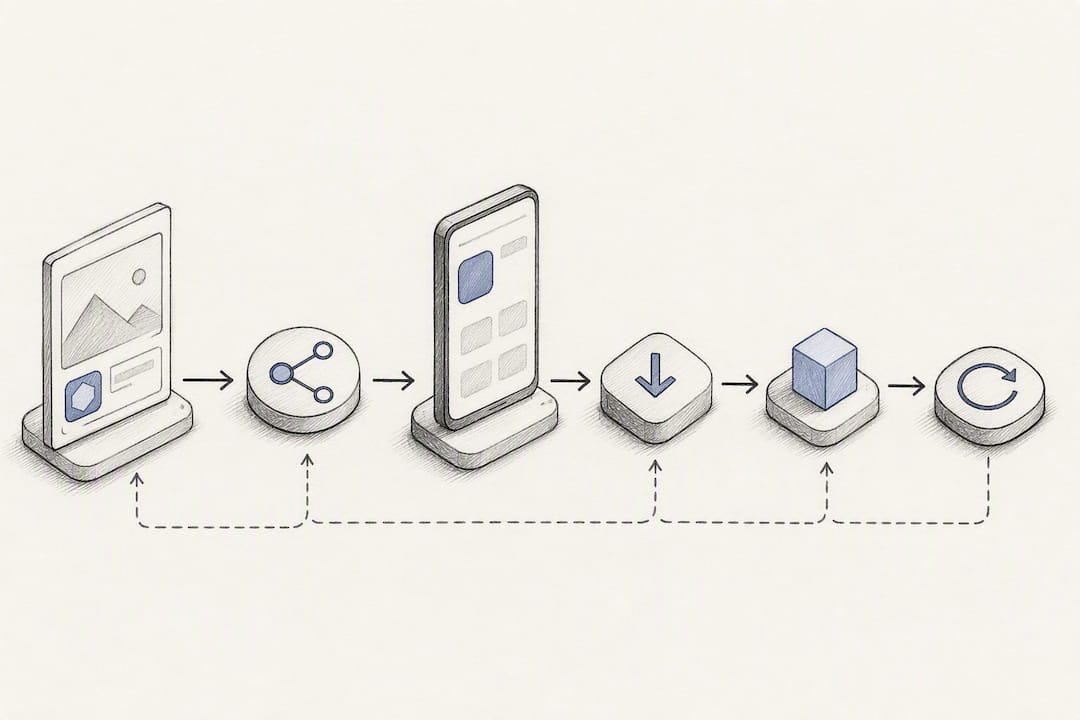
Practically, that means tracking creator campaigns with unique promo codes per creator and link-level attribution, then feeding what converts back into your listing experiments. A commission-only model with guaranteed view campaigns and a UGC-focused creator network can be built around that feedback loop: clients pay for verified views, not promises, which keeps the incentive aligned with actual install quality rather than raw impressions.
Author Perspective: Where to Focus First and What Trips Teams Up
If I had to run three experiments in order, they'd be a screenshot-and-video test on the store page, a custom product page aligned to your best-performing ad creative, and a small creator pilot with tracked promo codes compared against a paid sample of similar size.
The most common trap isn't a bad tactic. It's aggregating funnel stages into one blended number, then wondering why the result won't reproduce next month. A close second is ignoring traffic-source segmentation entirely, and a close third is calling a test result after a sample size too small to mean anything. Give listing experiments two to six weeks, and give creator-driven organic lift a 60 to 90 day window before judging it. Growth compounds slower than most dashboards make it look.
— Jax
When a Performance-Based Creator Network Makes Sense
If your install volume looks fine but activation and retention lag behind, the problem usually isn't your funnel math. It's the quality of the traffic filling it. A commission-only creator network built specifically for consumer tech apps charges clients a fixed rate per verified view, not a flat retainer, so the incentive to deliver install-ready traffic sits with the creator campaign, not just the media buy.
Consider this route if you're seeing volume without quality, if you need contextual traffic to stress-test a new creative direction before committing paid budget to it, or if you want a faster feedback loop into your listing experiments than cold paid traffic gives you. Guaranteed view campaigns, custom UGC production, and end-to-end creator management can help avoid managing a roster of individual creator relationships yourself. If low install quality despite decent volume sounds familiar, get in touch with Cult Media to talk through whether a creator-driven pilot fits your current funnel.
Sources
- Average App Conversion Rate per Category 2025
- App Store conversion rate benchmarks
- Mobile App Conversion Rate Benchmarks & Tips for 2026
FAQ
What Is a Good Conversion Rate for an App?
It depends entirely on the funnel stage. A page-view-to-install rate around 25% is solid for a US iOS listing, while a full impression-to-install rate of 3.6% to 3.8% is considered healthy globally.
Is 2.5% a Good Conversion Rate?
For install-to-purchase conversion, this figure is around the typical 1% to 2% band most retail apps see, with travel apps showing stronger performance. For impression-to-install, the rate typically sits at the 3.6% to 3.8% global average, so the answer changes completely depending on which metric you mean.
How Much Does an App With 10,000 Downloads Make?
There's no fixed figure, since revenue depends entirely on monetization model, category, and downstream conversion. A subscription app converting downloads to trials at 3.7% to 8.9% and trials to paid at 38% to 54% will earn dramatically more than a free app with no in-app purchases.
Does Apple Take 30% or 15%?
Apple's standard commission is 30% on in-app purchases and subscriptions, though it drops to 15% for developers enrolled in the App Store Small Business Program and for subscriptions after a customer's first year. Check Apple's current developer terms directly, since eligibility rules can change.
How Do I Compare My Conversion Rate to Industry Benchmarks?
Match your funnel stage, app category, store, territory, and traffic source before comparing, and lean on your own App Store Connect peer-group benchmarks over blended cross-industry averages whenever possible.