The single most important choice in any campaign report is the primary outcome metric, and it has to match the campaign's stated goal: ROAS for revenue campaigns, CPA or CPL for acquisition, branded search lift for awareness. Pair that number with two or three diagnostics on the same screen, spend, CTR or view rate, and conversion rate, so the reader can see why the number moved. The report should end in one sentence: continue, scale, reduce, or stop.
TL;DR:
- Focus on a single primary metric that directly reflects the campaign goal, accompanied by two or three diagnostics that explain its change.
- Use funnel-specific metrics, ensuring each belongs to acquisition, engagement, conversion, revenue, or retention, and consider caveats like attribution windows and channel influence.
- Compare multiple attribution models, such as last click and first click, to verify campaign performance and tie conversions to actual revenue.
- Build a simple, decision-focused report with the goal, spend, primary outcome, diagnostics, and a clear one-sentence recommendation, avoiding unnecessary metrics.
- For creator-driven campaigns, verify views are linked to installs and revenue, rather than relying solely on view counts or impressions.
Table of Contents
- Campaign Reporting Metrics by Funnel Stage
- How Do You Choose the Right KPI for a Campaign?
- Which Attribution Model Should You Trust?
- What Belongs in a Decision-Ready Campaign Report?
- Channel-Specific Metrics You Can't Ignore
- Applying This to Creator-Driven, Performance-Priced Campaigns
- Measure Less, Measure What Matters
- An Alternative Route to Measurable App Growth
- Sources
- FAQ
Campaign Reporting Metrics by Funnel Stage
Every metric belongs to a funnel stage, and mixing stages is how reports get confusing. Acquisition metrics (impressions, reach, CPM) tell you if people saw the campaign. Engagement metrics (CTR, video completion, engagement rate) tell you if they cared. Conversion metrics (CVR, CPA, form fills) tell you if they acted. Revenue metrics (ROAS, average order value) tell you if it paid off. Retention metrics (LTV, repeat purchase rate) tell you if it was worth acquiring them at all.
The formulas matter less than the caveats attached to them:
- CTR = clicks ÷ impressions. Watch for bot traffic inflating impressions on programmatic buys.
- CPC = spend ÷ clicks. Rising CPC with flat CTR usually signals auction pressure, not creative fatigue.
- CVR = conversions ÷ clicks. Always specify the attribution window; a 1-day and 30-day window on the same campaign can differ by double digits.
- CPA = spend ÷ conversions. De-duplicate conversions across channels before calculating, or you'll overcount.
- ROAS = revenue ÷ ad spend. Use gross revenue consistently, not a mix of gross and net across campaigns.
- CAC = total acquisition spend ÷ new customers. Include fully loaded costs, not just media spend, if finance is going to trust the number.
- LTV = average revenue per customer over a defined retention period.
A useful tiering framework separates metrics that are diagnostics, things that help you tune creative or targeting, from metrics that are outcomes, the ones that justify budget. AdStellar's tiering guide groups these into foundation, engagement, conversion, and business impact layers, which is a clean way to keep a report from treating a vanity metric like a funding decision.
How Do You Choose the Right KPI for a Campaign?
Pick one goal, then one primary metric. If you can't state the funding recommendation in a single sentence using that metric alone, you've picked the wrong one or you're tracking too many.
- State the goal in business terms. "Drive app installs at a sustainable CPA" is a goal. "Increase engagement" is not, unless engagement is genuinely the business outcome.
- Choose supporting diagnostics that change operational decisions. CTR tells you to swap creative. Post-click CVR tells you to fix the landing page. Frequency above 4 or 5 tells you to refresh assets before fatigue drags down CTR.
- Set cadence by audience. Campaign operators need weekly or even daily checks on live paid media. Marketing leads work in monthly cycles. Executives should see quarterly pipeline and ROI reviews, matched to how fast each group can actually act on the data.
Benchmarks help you sanity check results, but only within category. B2B PPC campaigns average a CTR near 6.66%, which is meaningless if you're comparing it against a B2C app install campaign.
Pro Tip: Build your own rolling 90-day internal benchmark before you ever compare against an industry average. Your last quarter is a better floor than someone else's vertical.
Which Attribution Model Should You Trust?
No single attribution model tells the whole truth, which is why comparing models matters more than picking a "correct" one. Last click credits the final touchpoint, which overweights bottom-funnel channels like search retargeting. First click credits the first touchpoint, which overweights awareness and top-funnel discovery. Multi-touch spreads credit across the path, which is more balanced but harder to explain to a finance team in one sentence.
A campaign that holds up under two or three models is far more dependable than one that only looks good under whichever model you happened to choose. Observix's guidance on campaign performance analytics makes this point directly: reconciling spend, engagement, and conversions back to actual revenue is what separates a defensible report from a flattering one.
Operationally, that means:
- Centralize CRM and revenue data so campaign conversions tie back to closed revenue, not just form fills.
- De-duplicate conversion events across platforms before totaling them.
- Run control groups (geo holdouts or audience splits) when budget allows, to measure incremental lift rather than assumed attribution.
- Pick one primary model for the headline number, then sanity check it against at least one alternative before presenting it.
What Belongs in a Decision-Ready Campaign Report?
A report that answers "should we keep funding this?" gets opened and acted on far more often than a multi-page data dump, according to Ordinal's reporting framework. That framework boils down to five required fields on the front screen: the goal, total spend, the primary outcome metric, two or three supporting diagnostics, and a one-sentence recommendation.
| Front screen | Appendix |
|---|---|
| Goal and campaign objective | Full impression and reach counts |
| Total spend to date | Channel-by-channel raw data dumps |
| Primary outcome metric (ROAS, CPA, etc.) | Vanity engagement metrics with no funnel tie |
| 2-3 supporting diagnostics | Historical trend charts beyond the current cycle |
| One-sentence recommendation | Segment-level breakdowns for deep dives |
Segmentation is where honest comparisons happen. HubSpot's campaign reporting documentation recommends using the campaign itself as the primary data source and breaking results out by asset type, so a blended average doesn't hide one format quietly losing money while another carries the whole campaign.
- Lead the report with a KPI card, not a chart.
- Follow it with a small diagnostics table, no more than four rows.
- Close with the recommendation row: continue, scale, reduce, or stop, stated once, in plain language.
Channel-Specific Metrics You Can't Ignore
Each channel has operational metrics that never belong on the front screen but will sink your top-line number if you ignore them. For email, that means sent, delivered, opens versus unique opens, unique clicks, delivery rate, and separating hard bounces (bad address) from soft bounces (temporary failure). Oracle Eloqua's documentation lays out this level of granularity because deliverability problems quietly distort every metric downstream of them. Authentication standards like SPF and DKIM affect whether emails even land in the inbox, which means a drop in opens can be a deliverability issue, not a content issue.
- Paid social and video: distinguish views from impressions, check viewability and completion rate, and watch frequency for ad fatigue signals.
- Search and programmatic: impression share, average CPC, and conversion window all shift with auction dynamics, not just creative quality.
- A channel metric only earns top-line placement when it's the bottleneck explaining the primary outcome metric's movement.
Applying This to Creator-Driven, Performance-Priced Campaigns
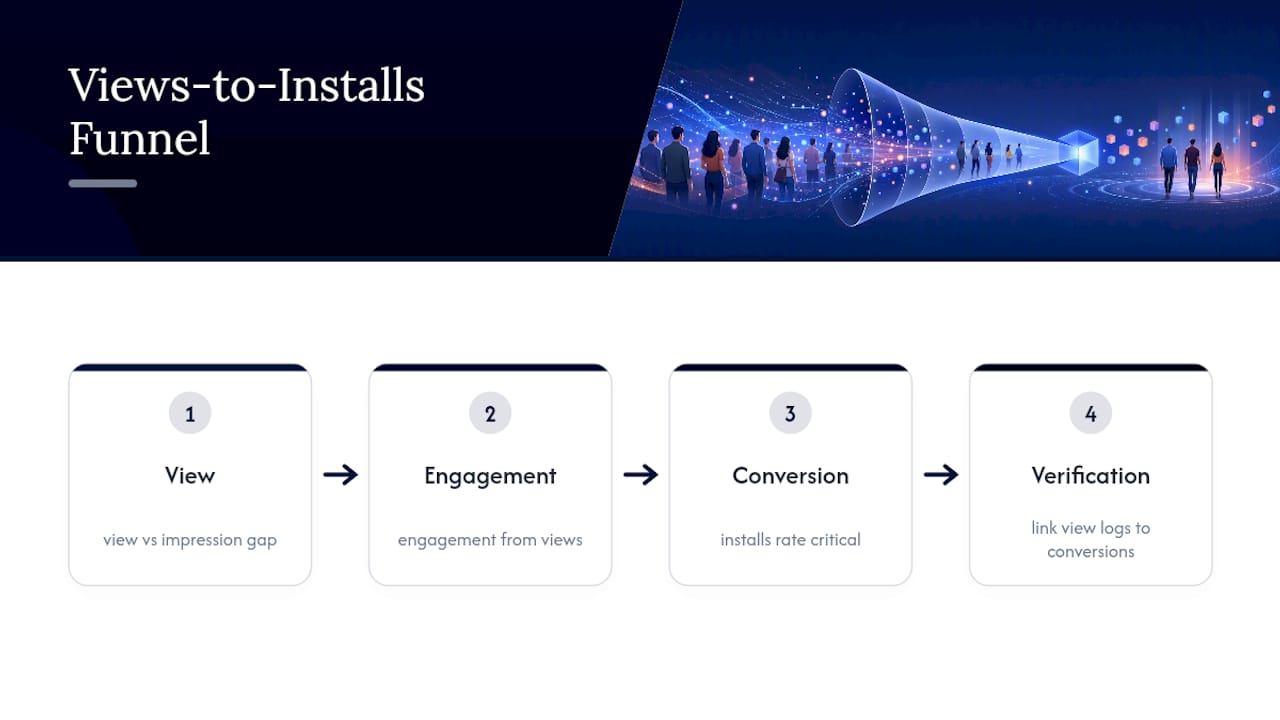
Guaranteed-view campaigns still map to the same funnel: views drive engagement, engagement drives conversion. The diagnostic that matters most here is whether views convert to installs at a rate that holds up, not the raw view count itself. Understanding the gap between a view and an impression is the first filter for attention quality, and choosing between micro and macro creators changes that conversion rate meaningfully. Verifying guaranteed views against actual installs requires tying creator view logs to first-party conversion signals. Without that link, you're reporting attention, not results.
Measure Less, Measure What Matters
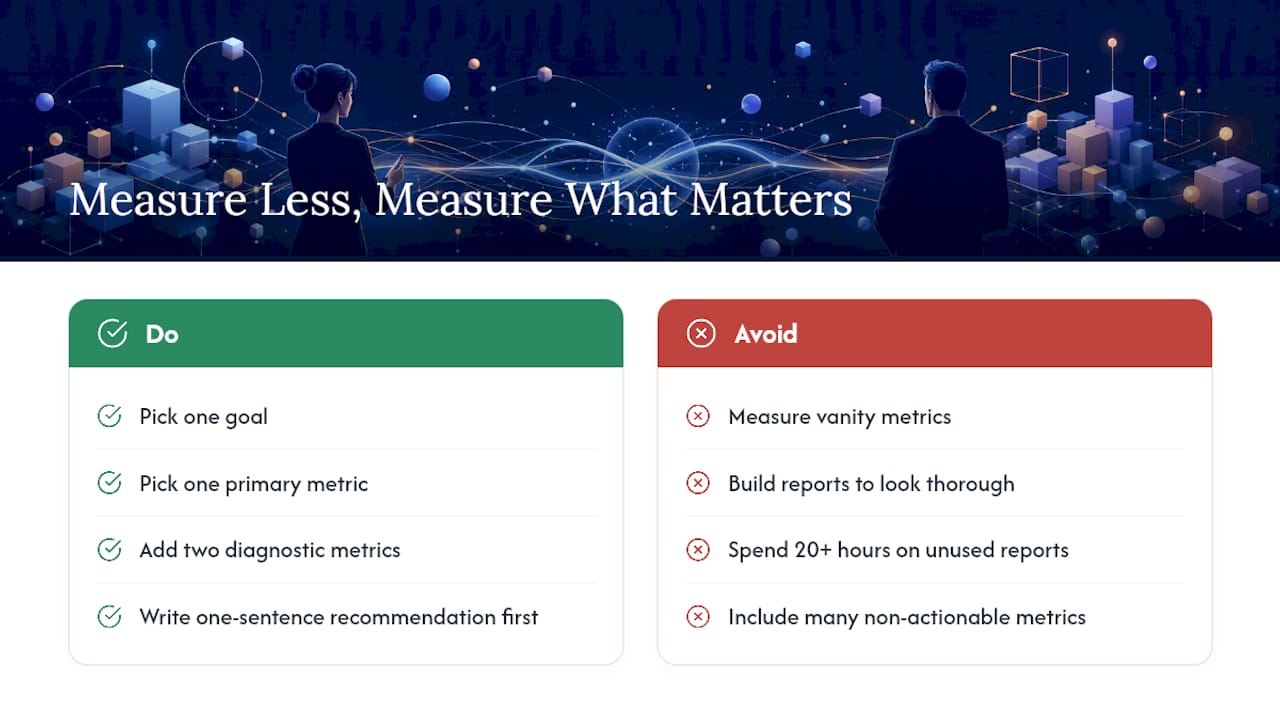
Most campaign reports drown in metrics that feel productive but change nothing. Marketers already spend more than 20 hours a year building reports stakeholders never engage with, and that waste usually traces back to reports built to look thorough instead of reports built to answer a question. Revenue-grade metrics beat vanity metrics every time finance is in the room.
The checklist I'd hand any campaign manager: pick one goal, pick one primary metric, add two diagnostics, and write the recommendation in one sentence before you touch a slide deck.
— Jax
An Alternative Route to Measurable App Growth
Some agencies offer guaranteed creator-driven views tied directly to installs, not just impressions billed by the hour. Some commission-based models charge per verified views, which means the reporting conversation starts where this article ends: primary outcome metric first, diagnostics second.

That structure only works if guaranteed views get tied to first-party conversion data, the same install and revenue signals covered above, so ROAS calculations hold up under scrutiny rather than stopping at view counts. Certain creator networks are built specifically for consumer tech apps, which means the campaign report built around them can lead with CPA or ROAS on day one instead of waiting on a vanity metric to mature into something useful. If you're planning a pilot or want to talk through how view-to-install measurement would work for your app, start the conversation with Cult Media.
Sources
- Campaign performance analytics
- Campaign reporting and metrics (Oracle Eloqua docs)
- Report on campaigns using the custom report builder | HubSpot
FAQ
What Is the Most Important Campaign Reporting Metric?
The primary outcome metric should always match the campaign goal, ROAS for revenue campaigns, CPA or CPL for acquisition, and it should sit alongside two or three diagnostics that explain its movement.
How Often Should Campaign Reports Be Updated?
Operators reviewing live paid campaigns need weekly or even daily checks, marketing leads work well on a monthly cadence, and executives typically need only quarterly pipeline and ROI reviews.
Which Attribution Model Is Best for Cross-Channel Campaigns?
No single model is universally best; a campaign that holds up under last click, first click, and multi-touch models is more trustworthy than one that only performs well under one chosen model.
How Do You Measure Performance for Creator-Driven Campaigns?
Track views through to installs by tying creator view logs to first-party conversion data, since a guaranteed view count alone doesn't confirm conversion quality. Networks like Cult Media structure pricing around verified views specifically so this link is measurable from the start.
What Should Be Left Out of the Main Campaign Report?
Raw impression counts, channel-by-channel data dumps, and engagement metrics with no clear funnel tie belong in an appendix, not on the front screen where the funding decision gets made.