
Video completion rate (VCR) equals completed views divided by video starts, multiplied by 100. It measures the share of viewers who watched a video through to the end, and platforms don't always agree on where "the end" is, with some counting [100% completion] and others stopping the clock at 95%](https://cloudinary.com/glossary/video-completion-rate).
A high VCR tells you the creative held attention. It does not tell you whether that attention turned into an app install, a signup, or a sale. That gap is exactly why VCR works best as a diagnostic tool paired with conversion data, not as a standalone scorecard.
A few things to keep in mind before you start pulling reports:
- Quartile data (25/50/75/100%) tells you where viewers dropped off, not just whether they did
- Benchmarks swing wildly by placement and length, so a "good" VCR on CTV looks nothing like a "good" VCR in a Meta feed
- Denominator choice (starts vs. impressions vs. billing metrics like ThruPlay) changes the number without changing the creative
The core formula to memorize: VCR = (Completed Views ÷ Video Starts) × 100. Everything else in this guide is about getting the numerator and denominator right, then acting on what the curve tells you.
Key Takeaways
Video completion rate tells you whether creative holds attention, but only pairing it with quartile diagnostics and conversion data tells you what to fix and whether it's working.
| Point | Details |
|---|---|
| VCR is diagnostic, not final | Pair completion percentage with conversion metrics before judging creative performance. |
| Denominator choice changes everything | Always confirm whether you're dividing by starts, impressions, or a billing metric like ThruPlay. |
| Benchmarks depend on format | A 25% VCR is weak on CTV but often normal in a Meta feed placement. |
| Quartile drop-off points to the fix | Early drops mean fix the hook; drops near 75% usually mean fix the CTA. |
| Data hygiene protects the number | Filter bots, deduplicate plays, and reconcile cross-device views before trusting VCR. |
Table of Contents
- How Do You Calculate Video Completion Rate?
- Why Do YouTube, Meta, and TikTok Report Completion Differently?
- What's a Good Video Completion Rate by Format?
- What Does a Drop in Completion at Each Quartile Mean?
- How Can You Improve Video Completion Rate?
- How Do Attribution and Data Hygiene Affect VCR?
- How Cult Media Uses Completion Data in Creator Campaigns
- Completion Rate Deserves Less Reverence Than It Gets
- Sources
- FAQ
How Do You Calculate Video Completion Rate?
Pull two numbers from your ad platform or analytics dashboard: completed views and video starts. Divide the first by the second, multiply by 100, and you have your VCR.
The numerator is where most reporting confusion begins. Some platforms count a completion only at 100% of runtime; others use a 95% threshold to account for buffering or auto-cutoff at the credits. Neither is wrong, but you need to know which one you're looking at before you compare two campaigns.
The denominator has three common candidates:
- Video starts — the cleanest option for creative testing, since it isolates how the video itself performed once someone pressed play or autoplay triggered
- 3-second views — used by some platforms as the "start" threshold, which inflates the denominator slightly and lowers the reported VCR
- Impressions — appropriate for measuring reach efficiency, not creative performance, since many impressions never scroll into view
Here's a worked example. A 30-second app-demo video gets 40,000 starts and 14,800 viewers watch to completion.
The most common mistake is mixing denominators mid-analysis, pulling completions from one report and plays from another, which creates comparisons that look meaningful but aren't. A close second: treating a platform's billing metric as if it were a completion metric. It usually isn't.
Why Do YouTube, Meta, and TikTok Report Completion Differently?
Every platform defines "watched" a little differently, and that difference changes what your VCR actually represents.

YouTube reports true quartile data (25/50/75/100%) for in-stream ads, and Shorts behave more like short-form feed content, where completion is easier to hit simply because runtimes are shorter.
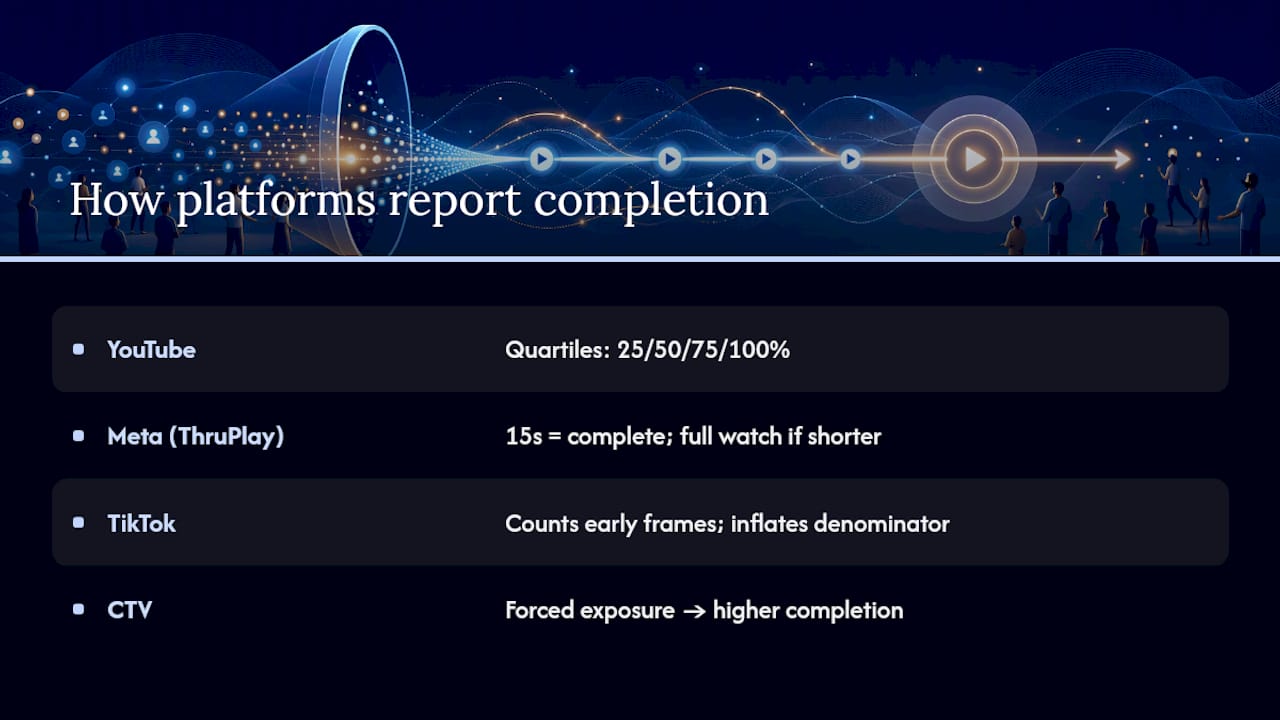
Meta complicates things with ThruPlay, a billing and optimization metric that counts a 15-second watch (or a full watch if the video is shorter) as a "complete" view for ad-delivery purposes. ThruPlay is not the same as 100% completion, and using it as your VCR numerator will overstate how many people actually watched the whole thing. Autoplay with sound off also means a chunk of "starts" never had real attention behind them.
TikTok and other short-form feeds define a "play" more loosely, often counting a view within the first few frames, which inflates the denominator and can flatter completion percentages for very short cuts.
CTV and non-skippable inventory sit apart from all of this. Because the viewer has no option to scroll past, completion rates in this format routinely land far above what any feed placement produces, which is a function of forced exposure, not necessarily stronger creative.
What's a Good Video Completion Rate by Format?
There's no single healthy number. What counts as strong VCR depends entirely on placement type and runtime, and treating a flat percentage as a universal goal will lead you to misjudge good creative as weak.
| Format / placement | Typical VCR range |
|---|---|
| CTV / non-skippable | a very high completion rate |
| YouTube skippable in-stream | a moderate completion rate |
| TikTok short-form native | a high completion rate |
| Meta feed placements | a low to moderate completion rate |
| Mid-length content | a solid mid-range completion rate |
| Long-form (5+ minutes) | a modest completion rate |
These ranges track closely with what's reported across feed, CTV, and short-form benchmarks, and the pattern makes sense once you think about viewer intent. A non-skippable CTV spot has a captive audience; a Meta feed ad is competing against a thumb that's already scrolling. A 25% VCR in a feed placement isn't a failure. A 25% VCR on CTV would be.
Pro Tip: Never benchmark a 15-second TikTok cut against a 90-second YouTube pre-roll. Match your benchmark to format and runtime first, then judge the number.
Use these ranges as a sanity check on your own historical data, not as a target to chase in isolation. A campaign beating its own format-specific baseline by 10 points is more useful signal than a raw percentage compared against an industry average that doesn't share your placement mix.
What Does a Drop in Completion at Each Quartile Mean?
Quartile curves turn a single VCR percentage into a map of viewer behavior, and that map is the fastest way to diagnose a weak creative.
A sharp drop between the start and the 25% mark almost always points to the hook. Viewers decided within the first few seconds that this video wasn't for them.
That last pattern is the one marketers most often misread. Combining VCR with conversion data resolves it:
| VCR level | Conversion level | Likely explanation |
|---|---|---|
| High | Low | Entertaining but not persuasive, weak or late CTA |
| Low | High | Efficient closer, front-loaded value, trim the fat |
| High | High | Working creative, candidate to scale spend |
| Low | Low | Wrong audience or wrong hook, test both |
The diagnostic matrix matters because the fix for "high VCR, low conversion" (sharpen the CTA) is the opposite of the fix for "low VCR, high conversion" (protect what's working, cut runtime elsewhere). Applying the wrong fix to the wrong pattern wastes a testing cycle you didn't need to lose.
- Big drop before 25%: rework the opening frame, not the whole script
- Sag between 25% and 50%: tighten pacing, cut a scene, or move the payoff earlier
- Drop near 75%: rewrite or reposition the CTA
- Flat curve, weak conversion: test a stronger, more specific ask
How Can You Improve Video Completion Rate?
Completion rate responds to specific, testable changes, not vague creative polish. Prioritize the ones that touch the biggest drop-off point on your quartile curve first.
- Fix the first three seconds before anything else. Open on the payoff, a stated problem, or a pattern break, since most feed drop-off happens before viewers commit to watching further.
- Trim runtime to match the story, not a template. If your quartile curve sags after the halfway point, you likely have 10 to 15 seconds of unnecessary setup to cut.
- Test 15-second cuts against 30-second cuts of the same creative. Shorter versions frequently post higher VCR on short-form placements without sacrificing the core message.
- Design for autoplay-muted environments first. Feed placements default to sound off, so lean on on-screen text and visual pacing, then layer sound-on cues for placements where audio starts by default.
- Move your CTA earlier and test against a late-card version. A mid-video CTA can catch viewers before the drop-off point your quartile data shows, rather than waiting for a moment many viewers never reach.
- Run A/B tests in pairs, one variable at a time. Compare hook A vs. hook B on identical runtime and CTA placement, and read results against both VCR and the conversion metric downstream, not VCR in isolation.
Formats built for short-form performance tend to reward tests two and three especially. Trimming a 30-second UGC cut down to 15 seconds often lifts completion percentage while barely touching absolute install volume, since the viewers who would have dropped at the 20-second mark never see the difference.
Pro Tip: Run your CTA-timing test before your hook test. A late CTA can mask a strong hook's real performance, and you'll waste a cycle optimizing the wrong variable.

How Do Attribution and Data Hygiene Affect VCR?
VCR is only as trustworthy as the traffic and attribution logic feeding it. Get either wrong and you're optimizing against noise.
Attribution systems assign downstream conversions to a prior view using configurable lookback windows, and whether a conversion counts as post-view, post-click, or hybrid changes what "worked" actually means. A 7-day post-view window will credit a video for a conversion that a 1-day window would miss entirely, which can make the same creative look dramatically more or less effective depending on which setting a platform defaults to.
For creative QA specifically, starts-based VCR is the more reliable read, since impressions-based view-through rate mixes in viewers who never really saw the video at all.
Data hygiene matters just as much as attribution logic:
- Filter bot and low-quality traffic before calculating completion, since inflated starts quietly deflate your VCR
- Deduplicate plays across sessions so one viewer replaying a video doesn't count as three completions
- Reconcile cross-device viewing carefully, particularly for CTV, where the same household may register multiple starts
- Feed VCR into the same dashboard as install and CRM events so quartile drop-off and downstream conversion sit side by side, not in separate reports
Median-based completion figures across a batch of videos, rather than single-video snapshots, also reduce the distortion one viral outlier can cause in a creator campaign's reported average.
How Cult Media Uses Completion Data in Creator Campaigns
Cult Media runs a commission-only creator network built around guaranteed, verified views for consumer tech apps. Clients pay a fixed CPM only on views that are confirmed real, and completion data is part of how that verification happens, alongside deduplication and traffic-quality checks on every campaign.
Across creator-led campaigns, certain patterns show up consistently:
- Native, in-feed UGC formats tend to post stronger completion than obviously scripted ad formats, because viewers don't immediately register them as ads
- Shorter cuts of the same core message routinely outperform longer versions on completion percentage without a proportional drop in install volume
- Creative that survives the first quartile intact is a far better predictor of scale-worthiness than raw view count alone
Completion rate by itself never decides which creative gets more budget. A video that holds attention to the end but produces no downstream installs gets flagged the same way a video with mediocre completion but strong conversion gets flagged, both need a different fix before they're worth scaling.
Cult Media pairs quartile data with install and conversion signals before recommending which creatives get pushed further into a guaranteed-view campaign, treating completion as one input among several rather than the deciding metric.
Completion Rate Deserves Less Reverence Than It Gets
Marketers treat video completion rate like a report card when it's closer to a symptom checker. The conventional advice, chase a higher percentage, misses that the number means something different in every placement and runtime, so a rising VCR with flat conversion isn't progress. It's a warning that your creative is likable but not persuasive.
The quartile curve is where the real information lives, and most teams skip straight past it to the headline percentage. That's backward. Treat them the same and you'll waste tests solving problems you don't actually have.
If there's one habit worth building, it's checking VCR against conversion before touching the creative at all. Completion without downstream results is a vanity metric wearing a performance metric's clothes.
Sources
- Video Completion Rate: The Formula, Real Benchmarks, and How to Read It | Viralix Blog
- How to Calculate Video Completion Rate: Free VCR Calculator | AdSights
- Conversion attribution process (Microsoft Advertising / Xandr documentation)
FAQ
What's a good video completion rate?
What is the difference between VCR and VTR?
VCR (video completion rate) measures completed views against video starts, while VTR (view-through rate) typically measures views against impressions, making VTR more of a reach efficiency metric than a creative-performance one.
How do I calculate the video completion rate?
Divide completed views by video starts and multiply by 100: VCR = (Completed Views ÷ Video Starts) × 100, using consistent numerator and denominator definitions from the same platform.