
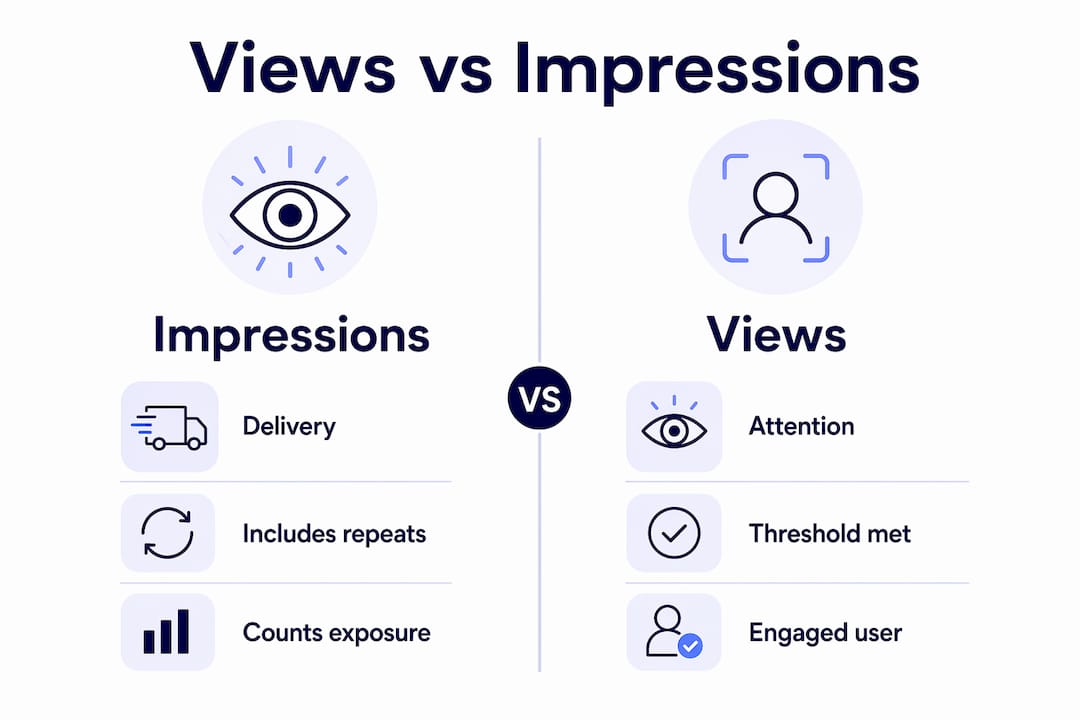
An impression is a delivery event. A view is an earned attention event. Every time content renders on a screen, that is one impression. A view only registers when a user actually consumes the content under platform-specific rules, whether that means an instant autoplay on TikTok, three seconds on Meta, or thirty seconds on YouTube.
Two rules of thumb worth keeping in your reporting toolkit:
- Impressions = potential reach and distribution. They tell you how many times your content was served, regardless of whether anyone stopped to watch.
- Views = earned attention. They tell you how many of those deliveries converted into actual consumption.
The immediate action: calculate your view-to-impression ratio (VTR) for every campaign. That single number tells you whether you have a distribution problem or a creative problem, and it is the fastest diagnostic available before you spend another dollar scaling.
Pro Tip: Start every campaign debrief by pulling impressions and views side by side. If the gap between them is widening over time, your hook is losing relevance, not your distribution.
Table of Contents
- What is an impression, exactly?
- What counts as a view, and why do thresholds matter?
- How do impressions and views compare across key dimensions?
- How each major platform defines impressions and views
- How to use impressions and views in reporting
- Common pitfalls and a troubleshooting checklist
- When guaranteed views and performance-based campaigns make sense
- Key Takeaways
- The metric gap most marketers misread
- Cultmedia delivers verified views, not just volume
- Useful sources
What is an impression, exactly?
An impression is recorded each time content is rendered on a user's screen. No click, no watch time, no interaction required. The platform simply logs that the content was delivered. That makes impressions a distribution metric, not an engagement metric.
Two distinct types show up in dashboards:
- Served impressions: The ad or post was delivered to a device. The system counts it regardless of whether the content was visible on screen.
- Viewable impressions: A stricter standard. The content must meet a minimum visibility threshold, typically 50% of pixels on screen for a defined duration, before the impression counts. Viewability standards differ by network and buy type.
Impressions also count repeated exposures from the same user. If one person scrolls past your post twice in a day, that is two impressions. This matters for CPM calculations because advertisers often pay per thousand served or viewable impressions, and frequency inflation can make reach look larger than it actually is. Separating reach (unique users) from total impressions is the only way to know how many distinct people your budget actually touched.
What counts as a view, and why do thresholds matter?
A view is a platform-defined event. Unlike impressions, views require some form of active consumption, whether that is a click-to-play, an autoplay that completes a minimum watch window, or a full video completion for short-form content. The threshold is what separates a view from a passive scroll-by.
Platform thresholds vary significantly:
- TikTok: A view registers at the moment of playback, with no minimum watch time. Autoplay counts immediately.
- Meta (Facebook and Instagram): Video views are commonly counted at approximately three seconds of playback.
- LinkedIn and X (Twitter): Both require roughly two to three seconds of watch time with at least 50% of the player visible on screen.
- YouTube: The threshold is approximately 30 seconds of watch time for standard long-form videos, or full completion for shorter content. YouTube also counts impressions separately when a thumbnail is displayed in a feed or recommendation panel.
Repeated plays and replays count as additional views on most platforms, which means a single engaged user can inflate view totals. Autoplay is the biggest driver of this inflation, particularly on TikTok, where the zero-threshold rule makes view counts easy to generate but harder to interpret as genuine attention signals.
Pro Tip: When normalizing cross-channel reporting, treat platform view thresholds as a diagnostic tier. Group TikTok instant-play views separately from Meta's three-second views and YouTube's thirty-second views. Comparing raw counts across those tiers produces misleading benchmarks.

How do impressions and views compare across key dimensions?
Treating views and impressions as interchangeable leads directly to flawed campaign reporting. The table below maps the core differences across the dimensions that matter most in a dashboard.
| Dimension | Impressions | Views |
|---|---|---|
| Definition | Content rendered on screen | Platform-defined consumption event |
| How it's counted | Served or viewable delivery | Playback meeting a minimum threshold |
| View threshold required | None | Varies: instant (TikTok), ~3s (Meta, LinkedIn), ~30s (YouTube) |
| Funnel role | Awareness and distribution | Engagement and consideration |
| Unique vs. total | Total (repeats included) | Total (repeats often included) |
| Reporting caveat | Does not confirm visibility or attention | Thresholds differ; raw counts are not cross-platform comparable |
The view-to-impression ratio formula:
VTR = Views ÷ Impressions
A campaign delivering a certain number of views from impressions produces a VTR that indicates your creative efficiency score. A low VTR typically signals that the first frame or metadata is failing to convert delivered impressions into initial consumption, not that your distribution is broken.
Key diagnostic signals from VTR:
- High impressions, low VTR: Creative or hook problem. Fix the opening frame before increasing spend.
- Low impressions, high VTR: Distribution is the constraint. The creative works; scale reach.
- Both low: Audience targeting and creative need simultaneous review.
Impressions will almost always exceed views because every view requires an impression first, but not every impression converts to a view. The gap between them is the story.
How each major platform defines impressions and views
Platform counting rules are not uniform, and they change. Recording the date of each benchmark you pull is not optional if you plan to compare performance across quarters.

YouTube
YouTube tracks thumbnail impressions separately from views. An impression is logged when a thumbnail appears in a feed, search result, or recommendation panel. A view requires approximately 30 seconds of watch time for standard videos, or full completion for short-form content. That strict threshold makes YouTube views among the highest-quality attention signals available in digital video.
Meta (Facebook and Instagram)
Meta counts video views at approximately three seconds of playback. Impressions are counted on delivery. Instagram made a notable change starting January 1, 2025, replacing its impressions metric with a broader "views" metric applied retroactively to historical data. Because this new views metric is more inclusive, it can run 25% or more higher than the old impressions figure, which means year-over-year comparisons on Instagram require careful adjustment.
TikTok
TikTok counts a view at the instant a video begins playing, with no minimum watch time. This makes TikTok view counts the easiest to generate across any major platform, but they carry the least signal about sustained attention. Watch time, completion rate, and shares are the metrics that actually indicate deeper engagement on TikTok.
LinkedIn counts impressions for static content when a post is at least 50% visible on screen. For video, a view requires three seconds of watch time with 50% visibility. That threshold aligns closely with Meta's standard, making LinkedIn and Facebook roughly comparable for video benchmarking purposes, though audience context differs significantly.
X (Twitter)
X registers a video view after two seconds of playback with at least 50% of the player visible. That is the lowest threshold among the major text-and-video platforms, which means view counts on X accumulate quickly but reflect minimal attention commitment.
Google Ads and Display Network
Google distinguishes between served impressions and viewable impressions. A viewable impression on the Display Network requires at least 50% of the ad to be visible for one second (two seconds for video). Cost-per-thousand-impressions (CPM) buys can be structured around either served or viewable counts depending on the campaign setup, so always confirm which definition applies before benchmarking.
| Platform | Impression definition | View threshold | Key caveat |
|---|---|---|---|
| YouTube | Thumbnail displayed in feed | ~30s watch time (or completion) | Strictest view standard; highest attention quality |
| Facebook/Meta | Content delivered to feed | ~3s playback | Impressions counted on delivery |
| Content delivered (now "views") | ~3s playback | Metric renamed in January 2025; historical data adjusted | |
| TikTok | Content delivered | Instant autoplay | Easiest view to generate; use completion rate for depth |
| 50% visible on screen | 3s + 50% visibility | Comparable to Meta for video benchmarking | |
| X (Twitter) | Content delivered | 2s + 50% visibility | Lowest threshold; views accumulate fast |
| Google Display | Served or viewable | 1s (display) / 2s (video) | Confirm served vs. viewable in campaign settings |
How to use impressions and views in reporting
The two metrics serve different roles in the funnel. Impressions belong at the top, measuring distribution and potential reach. Views belong in the middle, measuring whether distribution converted into attention.
Core KPIs and what they tell you:
- Impressions: Total delivery volume. Use to monitor distribution health and frequency.
- Reach: Unique users reached. Pair with impressions to calculate average frequency (Impressions ÷ Reach).
- Views: Attention events. Use to measure creative performance and hook effectiveness.
- VTR (View-to-Impression Ratio): Creative efficiency. Formula: Views ÷ Impressions.
- Completion rate: Depth of attention. Views that reach 100% of video length ÷ total views.
- CPM (Cost per Thousand Impressions): Distribution cost. Total spend ÷ (Impressions ÷ 1,000).
- CPV (Cost per View): Attention cost. Total spend ÷ Views.
Worked example:
A campaign spends a budget and delivers impressions and views, from which CPM, CPV, and VTR metrics can be calculated accordingly without exact amounts.
| Signal | What it means | Primary action |
|---|---|---|
| High impressions + low VTR | Hook or first frame is failing | Recut opening; A/B test thumbnails |
| Low impressions + high VTR | Distribution is the constraint | Increase paid reach or creator seeding |
| High VTR + low completion rate | Hook works; content loses attention mid-video | Tighten the middle; cut runtime |
| High CPV relative to benchmark | Paying too much per attention event | Improve VTR or renegotiate placement |
Segment every report by platform before drawing conclusions. A blended VTR across TikTok and YouTube is meaningless because the view thresholds are not comparable. Normalize by grouping view events into intent tiers: instant autoplay, short-threshold (two to three seconds), and long-threshold (thirty seconds or more). That structure makes cross-channel creative comparisons defensible.
Common pitfalls and a troubleshooting checklist
Most reporting errors with these metrics fall into a small number of repeatable patterns.
Frequent misreads:
- Mixing raw view counts across platforms. A TikTok view and a YouTube view are not the same unit. Never benchmark them side by side without normalizing by threshold tier.
- Treating impressions as unique reach. Total impressions include repeat exposures. Always pull reach separately to understand how many distinct users your content touched.
- Confusing served and viewable impressions. A served impression does not confirm the ad was visible. For paid buys, confirm whether your CPM is based on served or viewable counts before reporting efficiency.
- Autoplay inflation. Platforms that count instant-play views (TikTok) will always show higher view totals. That does not mean the creative performed better.
- Bot traffic and view fraud. Abnormal replay patterns, geographic clustering, and suspiciously high completion rates on low-budget buys are red flags. Third-party verification tools add a layer of protection on paid placements.
Troubleshooting checklist:
- Confirm the view threshold each platform used for the reporting period and record it.
- Pull reach alongside impressions to calculate actual frequency.
- Check for audience overlap if running across multiple platforms simultaneously.
- Review completion rate alongside VTR to distinguish hook failures from mid-content drop-off.
- For paid buys, validate delivery with platform-level logs and flag any abnormal replay spikes.
- If results look unexpectedly strong, A/B test a small incremental spend to confirm the distribution assumption before scaling.
Quick fixes when VTR is low: Tighten the first frame to under one second of visual payoff. Test three to five thumbnail variants. Run a small paid push to a cold audience to validate whether the problem is creative or targeting.
When guaranteed views and performance-based campaigns make sense
Guaranteed-view campaigns serve specific use cases well. App launches benefit from rapid awareness seeding before organic distribution builds momentum. New creative concepts need scale to validate hook performance quickly. Social proof, in the form of visible view counts, can accelerate organic distribution once the algorithm detects engagement signals.
The risk is paying for views that do not represent real attention. That risk is manageable with the right verification structure.
Verification checklist before committing budget:
- Define the exact view threshold used for payment. Instant-play and three-second views are not equivalent units.
- Require platform-level delivery logs, not just aggregate totals.
- Request a sample of view timestamps to check for abnormal replay clustering.
- Confirm whether the provider uses third-party view verification or relies solely on platform-reported data.
- Establish clawback or credit terms for views that fall outside agreed thresholds.
Pro Tip: Structure payment in tiers: pay one rate for instant-play views and a higher rate for three-second or longer views. That tiered model aligns cost with attention quality and gives you a built-in benchmark for creative performance across campaigns.
When a new creative format drives a lower cost-per-acquisition after a guaranteed-view seeding phase, the mechanism is usually this: early view volume generates social proof signals, which improve organic distribution efficiency, which reduces the paid volume needed to sustain momentum. The guaranteed-view buy is the catalyst, not the whole strategy.
Key Takeaways
Impressions measure delivery; views measure attention. The view-to-impression ratio is the single most useful diagnostic for separating creative problems from distribution problems in any campaign.
| Point | Details |
|---|---|
| Impressions vs. views | Impressions count every delivery; views require platform-defined consumption, making views the attention metric. |
| VTR formula | VTR = Views ÷ Impressions; a low VTR signals a hook or first-frame failure, not a distribution failure. |
| Platform normalization | Never compare raw view counts across platforms; group by threshold tier (instant, ~3s, ~30s) before benchmarking. |
| Instagram metric shift | Instagram replaced impressions with a broader views metric in January 2025; historical comparisons require adjustment. |
| Cultmedia approach | Cultmedia ties guaranteed-view campaigns to verified view tiers and platform-level logs, aligning cost directly with attention quality. |
The metric gap most marketers misread
The most common mistake is not confusing impressions with views. It is assuming that a high view count on one platform is equivalent to a high view count on another. A campaign that generates 500,000 TikTok views and 50,000 YouTube views has not necessarily performed better on TikTok. It has generated more instant-play events on a platform with a zero-second threshold, and more thirty-second attention events on a platform with the strictest threshold in mainstream video. Those are different products.
The diagnostic that actually matters is not the raw view number. It is the VTR within each platform, tracked consistently over time. When a platform's VTR drops while impressions hold steady, the creative is losing effectiveness, not the distribution. That is the signal to act on, and it is invisible if you are only watching total view counts.
One more thing worth flagging: platforms change their definitions. Instagram's January 2025 shift from impressions to a broader views metric is a recent example. Any benchmark you set today may not be directly comparable to data pulled twelve months from now. Record the platform's definition and the date every time you establish a baseline. That discipline is what separates reporting that compounds in value from reporting that just fills a slide deck.
Cultmedia delivers verified views, not just volume
If you need guaranteed views quickly, the model matters as much as the number. Cultmedia operates a commission-only creator network built specifically for consumer tech apps, delivering guaranteed-view campaigns where payment is tied directly to verified views, not promises. Clients pay a fixed CPM only for views that meet agreed thresholds, confirmed through platform-level logs and transparent delivery reporting.

That structure addresses the core risk in any guaranteed-view buy: paying for autoplay inflation or bot-driven replay patterns that never convert. Cultmedia's creator network generates UGC-led content distributed across TikTok, Instagram, and other high-reach platforms, with end-to-end creator management included. No retainer, no flat fee regardless of results. The incentive is aligned: views delivered, payment earned.
If you are evaluating a guaranteed-view campaign for an app launch or creative validation push, review how Cultmedia structures performance campaigns and request a campaign assessment to see what verified delivery looks like in practice.
Useful sources
- YouTube Help: Impressions and how they lead to watch time — YouTube's official documentation on how thumbnail impressions are counted and how they relate to views and watch time.
- Meta Business Help: Video metrics — Meta's definitions for video views, impressions, and reach across Facebook and Instagram.
- TikTok for Business: Understanding video metrics — TikTok's official guidance on how views, impressions, and engagement are counted in the Ads Manager.
- LinkedIn Marketing Solutions: Video ad metrics — LinkedIn's definitions for video views and impression counting standards.
- Google Ads Help: About viewable impressions — Google's explanation of served vs. viewable impressions and Active View measurement standards.
- X (Twitter) Ads Help: Video views — X's definition of a video view (two seconds, 50% visibility) and how impressions are counted.
- Socialinsider: Impressions vs. Views — Practitioner explainer covering platform-specific thresholds and the foundational difference between the two metrics.
- Indeed Career Advice: Social media impressions vs. views — Clear breakdown of served vs. viewable impressions and how CPM buys interact with each type.
- Postplanify: Views vs. impressions full guide — Detailed platform comparison including TikTok's instant-play counting and normalization guidance.
- Cultmedia: Performance-based creator network — Overview of how Cultmedia structures guaranteed-view campaigns with verified delivery across TikTok and Instagram.